
Tutorial Time Chart Report
The report analyzes how students spend time on tutorials within a specific course.
Report Data Summary:
- Tracking Usage: The system tracks students' time on tutorials within the EducoSoft platform.
- Data Points: It collects data on activities such as tutorials, e-books, and lecture videos.
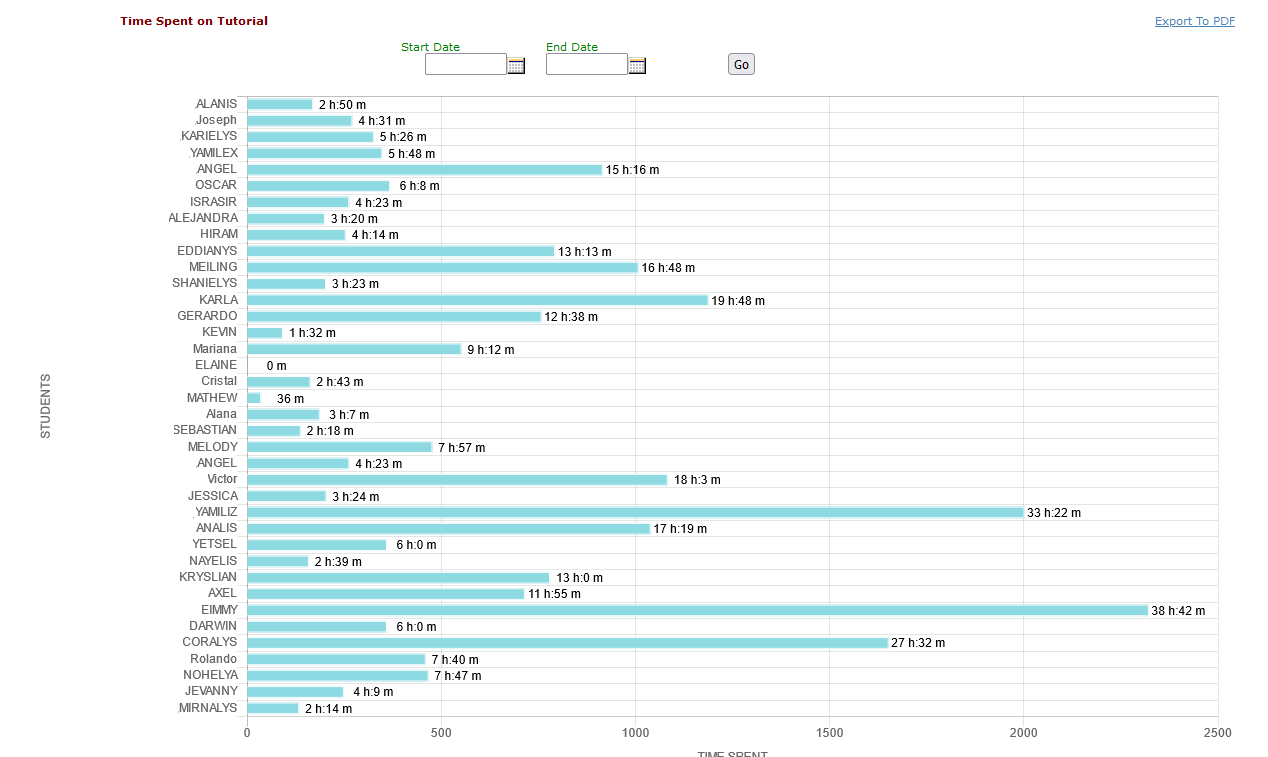
Data Presentation:
- Percentage Breakdown: The bar chart shows the percentage of total time spent on Tutorial activity.
- Visual Representation: It visually represents how much each student spent on tutorial activities and provides the time spent in hours, minutes, and seconds corresponding to the student’s name.
Usage:
- Instructors: Instructors can use this report to understand how students engage with the course materials and identify areas needing more attention or different teaching strategies.
- Students: Students can use the report to reflect on their study habits and adjust their time allocation across different activities.
- Administrators: Educational administrators can use the report to assess the effectiveness of the course materials and make data-driven decisions to improve the learning experience.